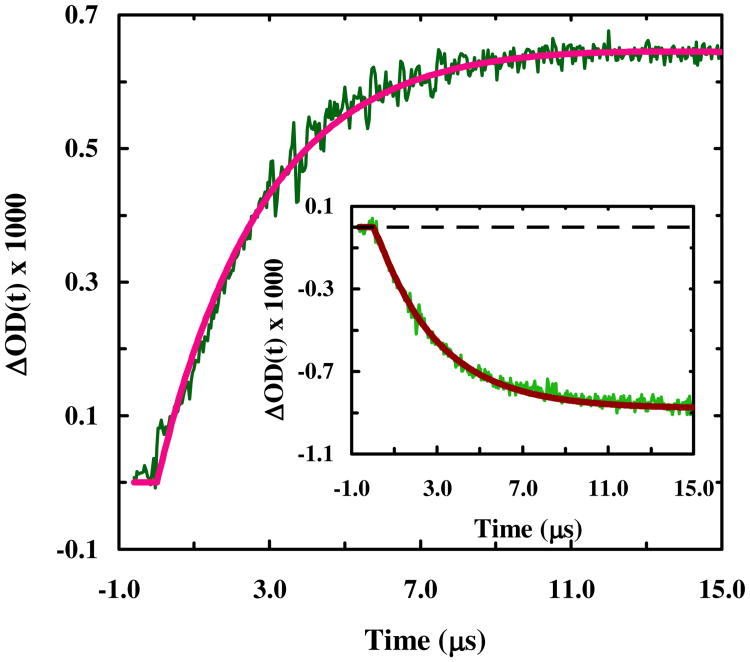
Figure 3.
Relaxation kinetics of 4-8-CL-Trp-cage in response to a T-jump from 29.3 to 42.1 °C, probed at 1668 cm-1. The smooth line represents the best fit of this curve to a single exponential function with a relaxation time constant of 2.7 μs. Shown in the inset are the relaxation kinetics of the same peptide obtained with a probing frequency of 1620 cm-1 in response to a T-jump of 29.1 to 43.4 °C. Fitting this relaxation curve to a single exponential function yielded a relaxation time constant of 2.9 μs.

