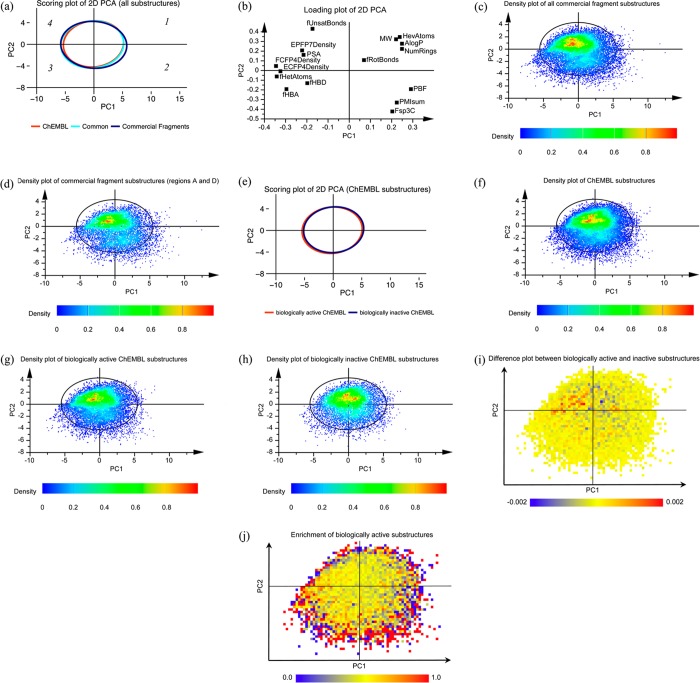
Figure 3.
2D PCA of the chemical space analyzed. Quadrants are counted clockwise with the first quadrant in the top right corner. (a) Scoring plot with ellipses showing the 95% confidence intervals of the distributions of substructures derived from ChEMBL compounds (red), Ro3-compliant commercial fragments (blue), and those common to both data sets (region A in Figure 2a) (cyan). Numbers within the plot in italics illustrate the quadrant numbers. (b) Corresponding loading plot. (c) Density plot of the distribution of all substructures from commercial fragments. The ellipse (same for figures (d), (f), (g), and (h)) corresponds to a confidence level of 95% of Hotelling’s T2 distribution of the entire chemical space analyzed. (d) Density plot of the distribution of commercial fragments that are identical to, or considered chemically similar to, bioactive ChEMBL substructures (regions A and D in Figure 2b). (e) Scoring plot with ellipses showing the 95% confidence intervals of the distributions of substructures derived from biologically active ChEMBL compounds (red) and those only from inactive compounds (blue). (f) Density plot of the distribution in (e). (g) Density plot of the distribution of biologically active ChEMBL substructures in (e). (h) Density plot of the distribution of biologically inactive ChEMBL substructures in (e). (i) Difference plot of (e) between the normalized occupancy of biologically active and inactive substructures within each cell. (j) Enrichment plot of (e) showing the ratio of the normalized occupancy of biologically active substructures to all substructures within each cell.

