Figure 1.

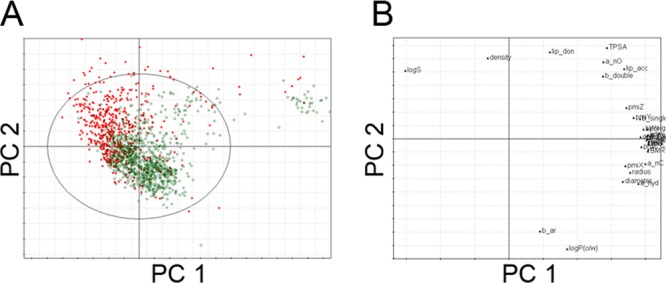
(A) Score plot from principal component analysis (first two principal components shown). Inhibitors are shown in green circles and noninhibitors are shown in red dots. (B) Loading plot of descriptors used for PCA analysis.

(A) Score plot from principal component analysis (first two principal components shown). Inhibitors are shown in green circles and noninhibitors are shown in red dots. (B) Loading plot of descriptors used for PCA analysis.