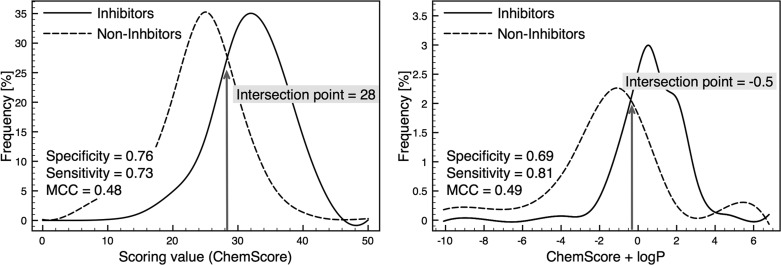
Figure 6.
Distribution of P-gp Inhibitors and Noninhibitors based on ChemScore scoring. Sensitivity, specificity and MCC were calculated from true and misclassification rate at intersection point of two curves. (A) Distribution based on ChemScore alone and (B) distribution based on a combined ChemScore-logP score.

