
FIGURE 2.
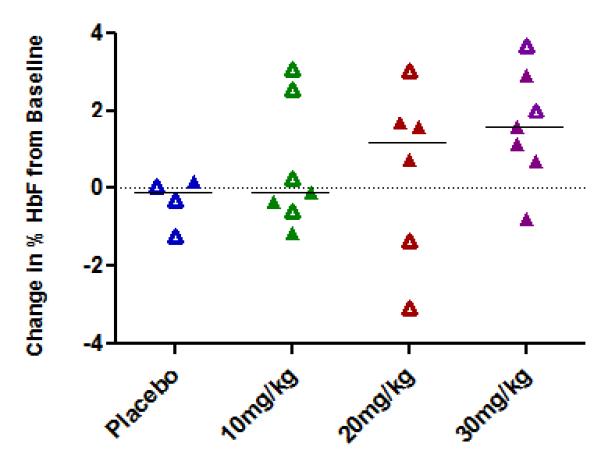
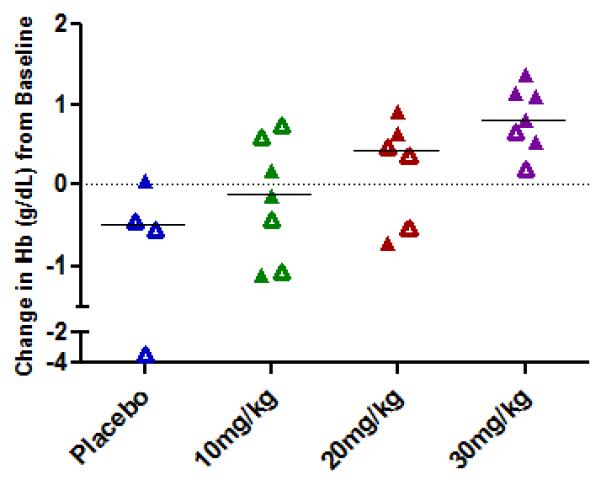
Changes from baseline in % HbF (top panel) and total Hgb (bottom panel) in the 3 dose cohorts.
A. Changes in % HbF are shown in individual subjects in each of the 4 treatment groups. Open symbols represent values in subjects on concomitant hydroxyurea treatment.
B. Changes from baseline in total Hgb are shown in individual subjects in each of the 4 treatment groups. Open symbols represent values in subjects on concomitant hydroxyurea treatment.