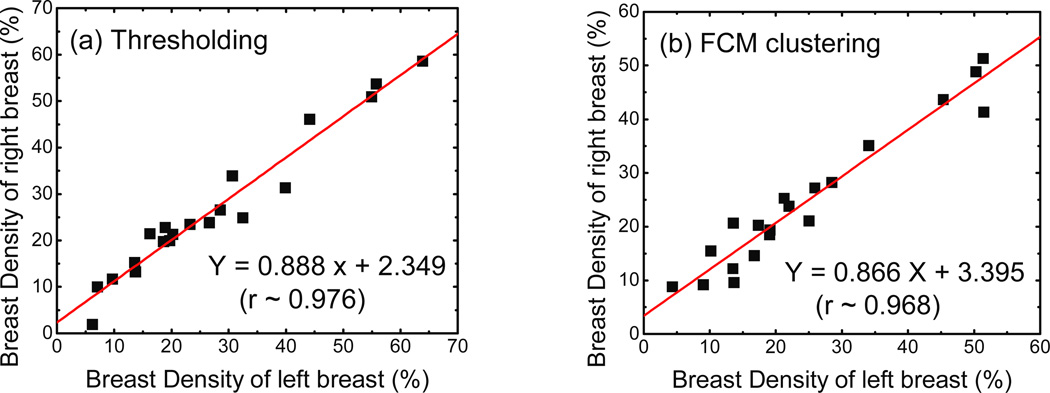
Figure 6.
Left-right comparisons for breast density measurements from (a) thresholding and (b) FCM segmentation. The linear fits for each method are also shown with standard errors of 3.39% and 3.35% respectively. Note that both methods have a Pearson’s r > 0.95. Hence both methods are precise in their measurements of breast density.

