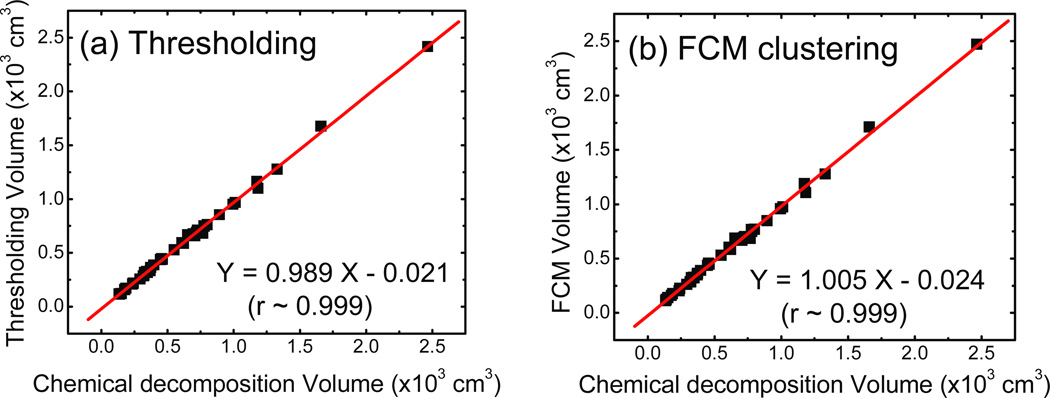
Figure 8.
Total breast volume comparison for the (a) histogram thresholding and (b) FCM clustering techniques as a function of the value determined from chemical decomposition. The linear fits both have slopes that are very close to unity and correlation coefficients greater than 0.99. Hence, volume measurements in the image domain are considered accurate.

