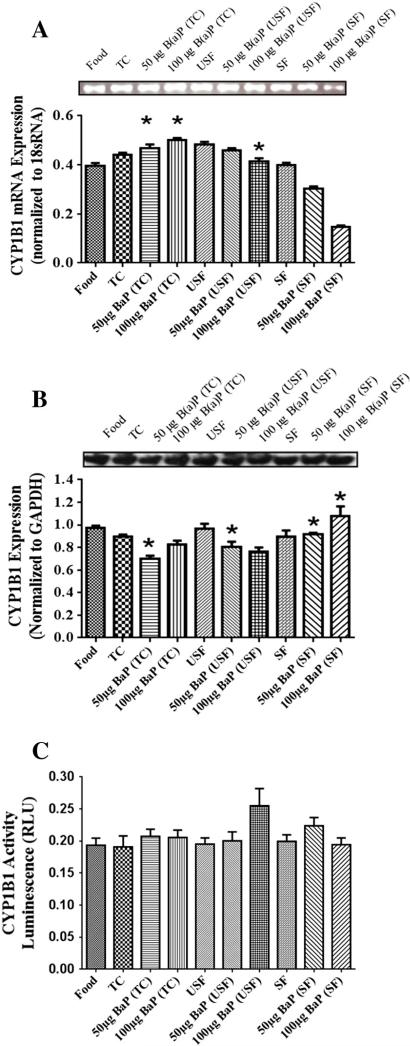
Fig. 2.
(A) RT-PCR analysis of liver CYP1B1 mRNA expression in ApcMin-exposed mice. The relative expression of CYP1B1 was quantified by densitometric quantitation of CYP1B1 bands and normalized to level of 18 sRNA. The bars represent mean±S.D. for three independent experiments. *P<.005, when 50 μg B(a)P+TC, 50 μg B(a)P+USF and 50 μg B(a)P+SF compared to 100 μg B(a)P+TC, 100 μg B(a)P+USF and 100 μg B(a)P+SF, respectively; and when B(a)P+TC is compared to TC. (B) Western blot analysis of liver CYP1B1 protein expression in ApcMin-exposed mice. Mice were exposed to either vehicles (TC, USF or SF) or B(a)P (50 μg-TC, 100 μg-TC, 50 μg USF, 100 μg USF, 50 μg SF and 100 μg SF) for 60 days via oral gavage. The relative expression of CYP1B1 was quantified by densitometric quantitation of CYP1B1 bands and GAPDH was used as the loading control. The bars represent mean±S.D. for three independent experiments.*P<.005, when 50 μg B(a)P+SF and 50 μg B(a)P+USF are compared to 50 μg B(a)P+TC and 50 μg B(a)P+SF, respectively; and when 100 μg B(a)P+SF group is compared to both 100 μg B(a)P+USF and 100 μg B(a)P+TC groups. (C) Enzyme activity of liver CYP1B1 in ApcMin-exposed mice. The activity of CYP1B1 was determined using luminescence detection. The bars represent mean±S.D. for three independent experiments.

