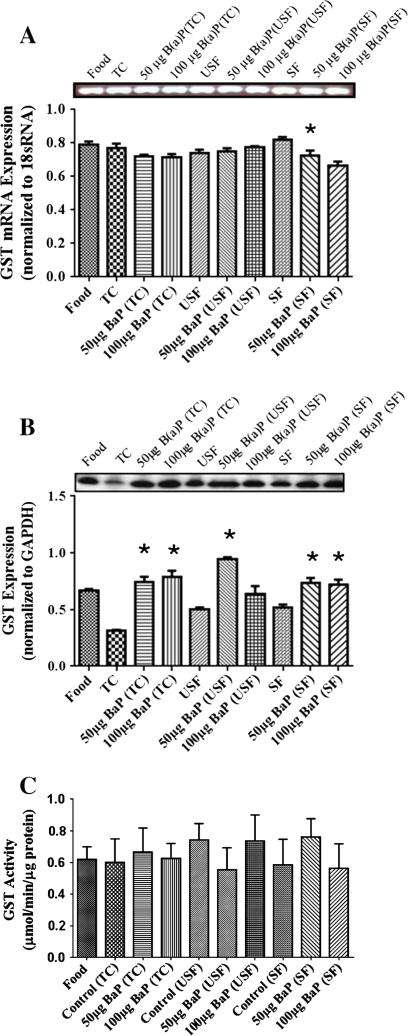
Fig. 6.
(A) RT-PCR analysis of colon GST mRNA expression in ApcMin-exposed mice. The relative expression of GST was quantified by densitometric quantitation of GST bands and normalized to level of 18 sRNA. The bars represent mean±S.D. for three independent experiments. *P<.005 when 50 μg B(a)P+SF is compared to SF, and 100 μg B(a)P+SF. (B) Western blot analysis of colon GST protein expression in ApcMin-exposed mice. The relative expression of GST was quantified by densitometric quantitation of GST bands and GAPDH was used as the loading control. The bars represent mean±S.D. for three independent experiments. *P<.005, when B(a)P+TC and B(a)P+SF are compared to their respective control groups for both the doses; and when 50 μg B(a)P+USF are compared to 100 μg B(a)P+USF, 50 μg B(a)P+SF and 100 μg B(a)P+SF. (C) Enzyme activity of colon GST in ApcMin-exposed mice. The activity of GST was determined using a spectrophotometer. The bars represent mean± S.D. for three independent experiments.

