Shahar E, Shahar DJ. Clinical Epidemiology. 2012;4:137–144.
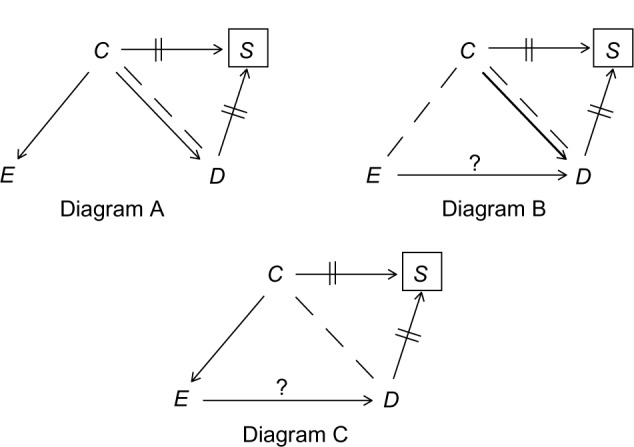
On page 140, Figure 8 Diagram B shows a cause of D that is not a confounder. After conditioning on S, an association is also created between E and C, and therefore, a dashed line should connect these variables (revised figure below). As a result, three paths (not two) now connect C and D (C -- E→D; C→D; and C -- D). Since these three paths sum up to a null association between C and D, the sum of C→D and C -- D is not null, and colliding bias is present (unless the effect of E on D is precisely null).
Figure 8.

Special cases of matching: no net bias under the precise null (A); colliding bias in the absence of confounding bias (B and C).
Note: The question mark denotes the effect of interest.


