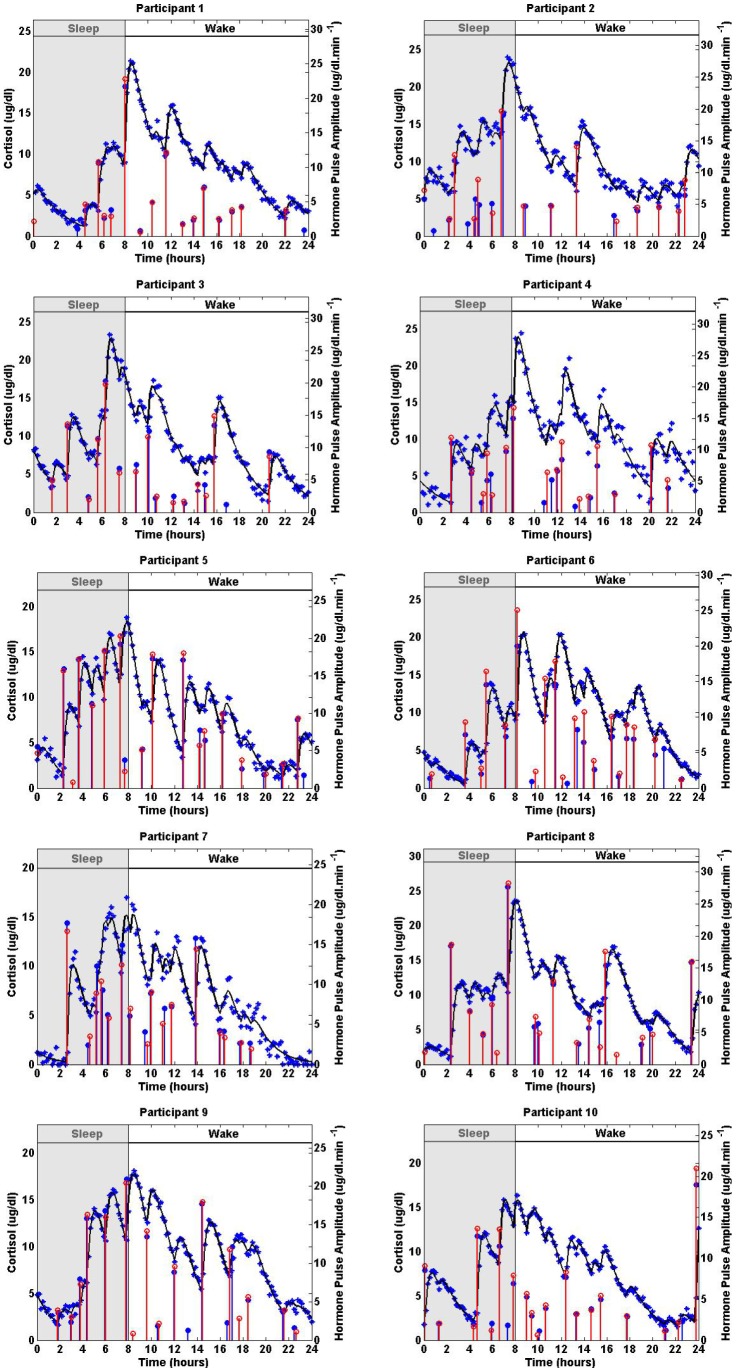
Figure 4. Estimated Deconvolution of Simulated Twenty-Four-Hour Cortisol Levels with Different Measurement Errors Corresponding to Datasets from 10 Women.
Each panel shows the simulated 24-hour cortisol time series (blue stars), the estimated cortisol levels (black curve), the simulated pulse timing and amplitudes (blue vertical lines with dots) and the estimated pulse timing and amplitudes (red vertical lines with empty circles) for one of the simulated datasets that each correspond to a participant. The estimated parameters are given in Table 3.

