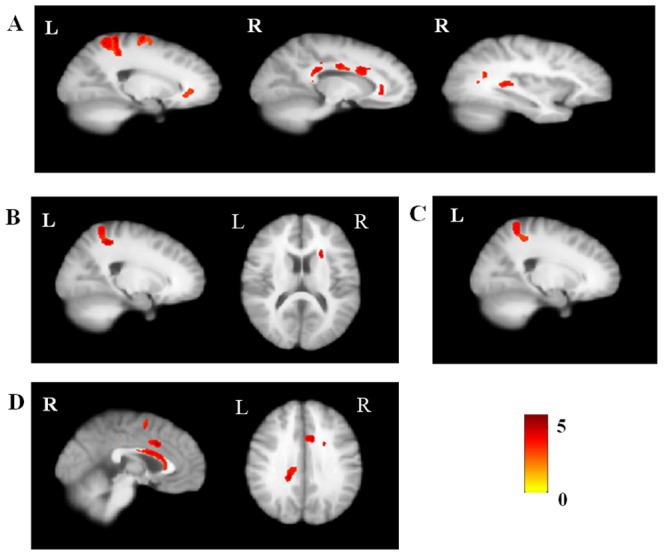
Figure 1. Regions showing significant fractional anisotropy (FA) differences between patients with OCD, their unaffected siblings, and healthy controls.

(A) patients with OCD<healthy controls; (B) Siblings<healthy controls; (C) The common regions in which patients with OCD and unaffected siblings both had significant FA differences compared to the healthy controls; (D) Patients with OCD<siblings.
