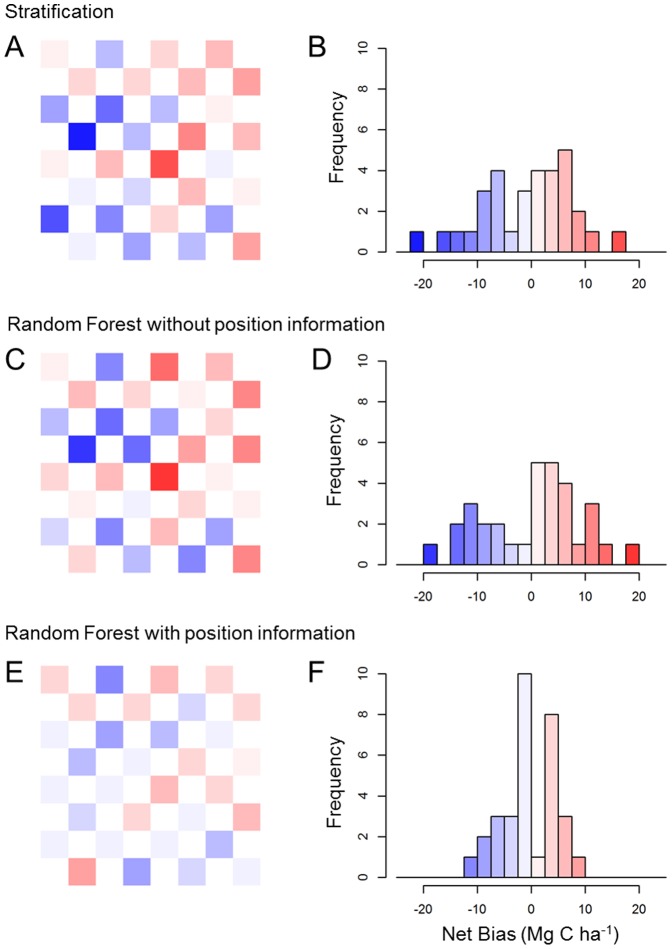
Figure 7. Spatial performance of each modeling approach within 36 validation regions.
The net bias for the model was determined against the aircraft-based observed validation data (i.e., 1-ha CAO aircraft samples shown in black in figure 1). The color-scale is defined within the histograms, and is constant in all panels.

