
Figure 8. Variograms of residuals from three model predictions of carbon stock in the focal area: Stratification (black circles), Random Forest without position information (red open circles), and Random Forest with position information (red circles with target).
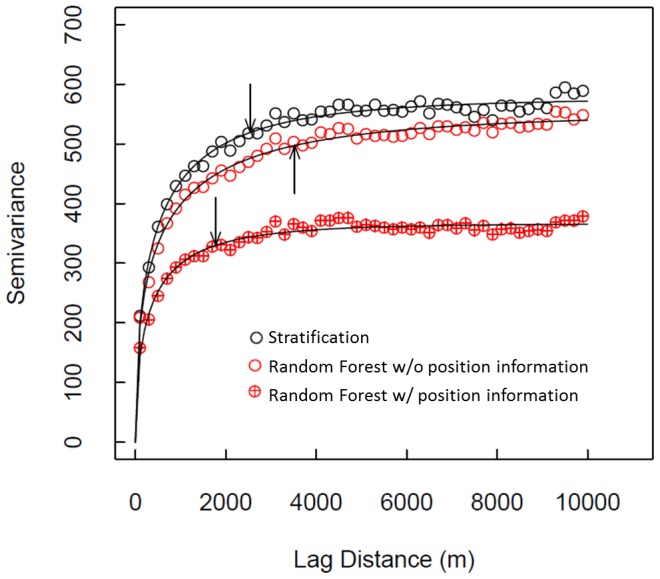
Fitted curves are weibull functions, and the arrows indicate a y-axis value of 90% of the fitted asymptote (i.e., the “a” parameter in the weibull function).