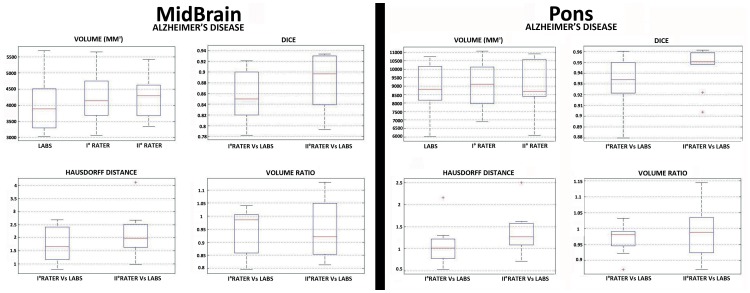
Figure 8. Box and whisker plots of volume quantification, DICE coefficient, Hausdorff Distance and Volume Ratio for each brainstem subregion in a selected population of AD patients (n°10) extracted from ADNI database (Siemens 1.5T, ADNI database).
Values outside ranges are plotted individually (red cross).

