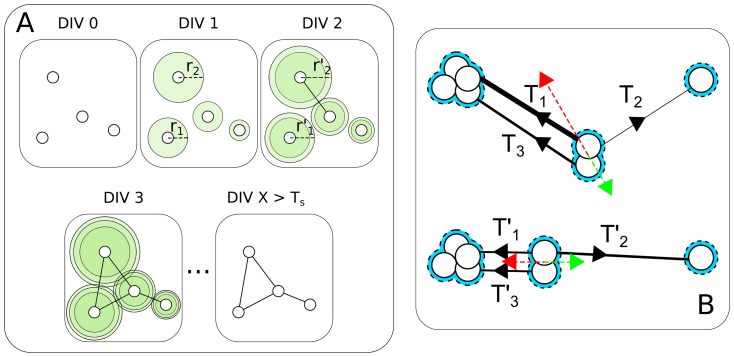
Figure 6. Growth model.
(A) Schematic representation of how cells get connected. At DIV 0, 4 cells of radius  are located at random positions. The first iteration of the algorithm, DIV 1, assigns to each cell
  a disk of radius
  (green shade). At the next iteration, DIV 2, the disk's growth rate decreases,
  , and a link between two cells is established when their disks intersect (DIV 3). This process continues until
  steps. (B) Force diagram explaining cell migration and clustering. Tension forces
  ,
,  , and
, and  are acting on the central cluster composed of two cells, whose vector sum (red arrow) exceeds the adhesion to the substrate (green arrow). As a result, a new equilibrium state is produced with new tension forces
  ,
,  , and
, and  , being the central cluster pulled in the direction of the net force approaching the largest cluster.

