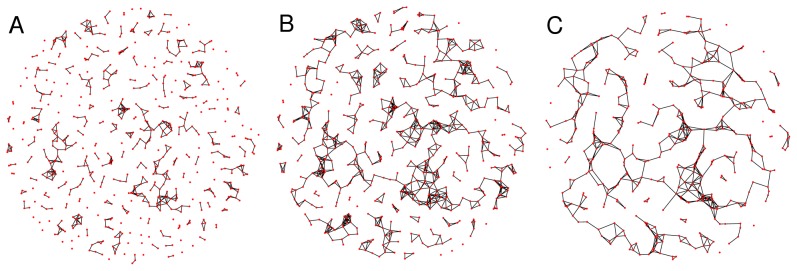
Figure 7. Schematic illustration of the network self-organization at three different instants of the automata generations.

(A) DIV 3, (B) DIV 6, and (C) DIV 12. Simulation parameters:  ,
,  , and
, and  .
.

(A) DIV 3, (B) DIV 6, and (C) DIV 12. Simulation parameters:  ,
,  , and
, and  .
.