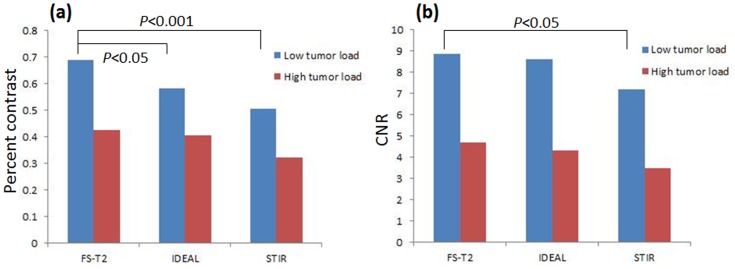
Figure 2. Percent contrast and CNR comparison among the three different fat-suppression sequences.
BM-focal lesion percent contrast (a) and CNR (b) are significantly greater for FS-T2 FSE than for STIR in the low tumor load BM groups (P<0.001, P<0.05, respectively). In the low tumor load BM group, percent contrast is significantly higher for FS-T2 FSE than for water image of IDEAL (p<0.05).

