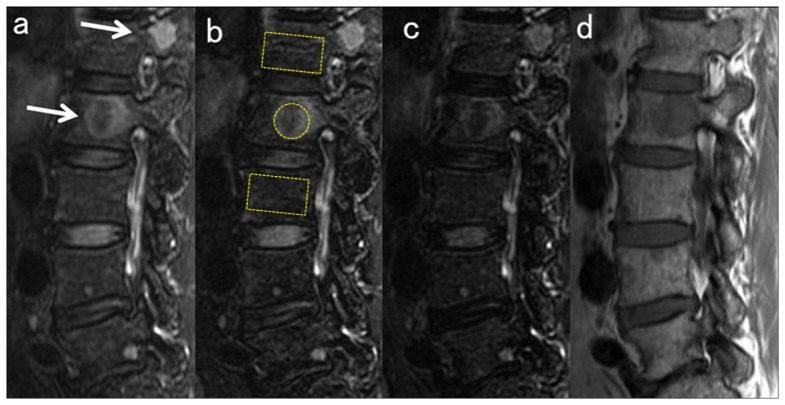
Figure 3. Sagittal MRI in a 58-year-old woman with focal myeloma lesions in the low tumor load group (BMPC%, 12%).
a) Water image of IDEAL; b) FS- T2 FSE; c) STIR; and d) T1 FSE. ROIs of lesion and background BM used for the percent contrast computation are demarcated in the images. Actual ROIs of BM are placed in similar locations in the midsagittal images. The focal myeloma lesions in L1 and L2 are easily detected as a high intensity signal on fat-suppressed images (white arrows). Among the three fat-suppressed images, signal hyperintensity of the lesion is less conspicuous in STIR (c) than in water image of IDEAL (a), which seems to be due to the lower SNR in STIR.

