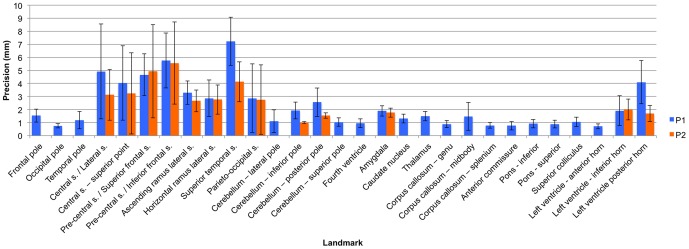
Figure 2. Histogram of the intra-observer precision of each landmark.

This histogram indicates the level of intra-observer precision associated with each landmark using the original (P1) and modified (P2) protocols. The error bar is equal to one standard deviation above and below the mean. Landmark numbers correspond with the landmark numbers in Table 2.
