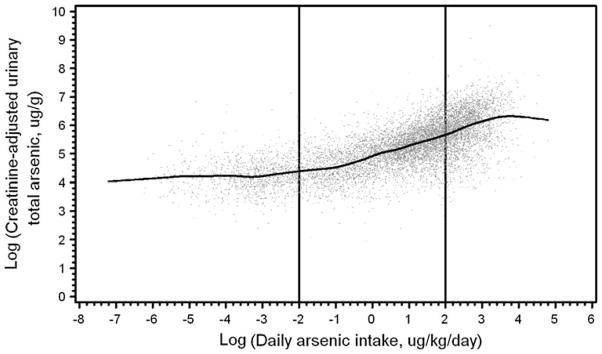
Fig. 1.

Scatterplot of logarithms of creatinine-adjusted urinary total arsenic versus daily arsenic intake with individual values plotted as gray points and cubic smoothing spline indicated in black line. The vertical lines at −2 and +2 indicate location of knots for linear spline regression model used in subsequent analyses
