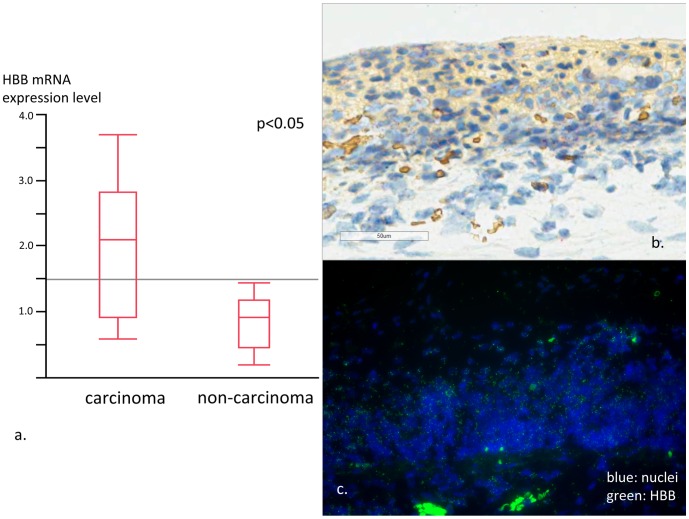
Figure 5. Results of RT-PCR and in situ hybridization.
a. Expression level of HBB was significantly higher in carcinoma tissue compare to non-cancerous surrounding tissue. The amount of expression varied highly in cancer tissue. On the other hand, the expression level contributed to relatively narrow range in non-cancerous tissue. b. ISH image from cancer area. HBB mRNA expression (red) was observed in the cancer area. c. ISH fluorescent image from cancer area showed strong positivity for HBB mRNA expression (green).

