
Figure 2. BMVC expression of transformed cells in a time- and dose- dependent manner.
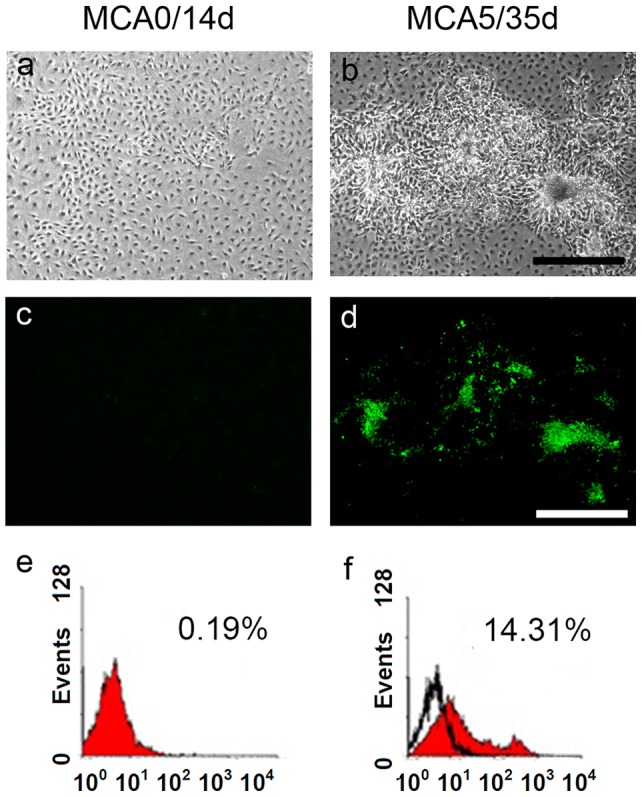
(a, b) Morphological phenotypes of BLAB/c 3T3 cells treated with MCA of different doses (0, 5 μg/ml) and cultured for different periods (14, 35 days). Scale bar = 500 μm. (c, d) BMVC expressions of MCA-treated cells were detected by fluorescence microscopy. Scale bar = 500 μm. (e, f) The percentage of positive BMVC expression of MCA-treated cells was determined and analyzed by flow cytometry.