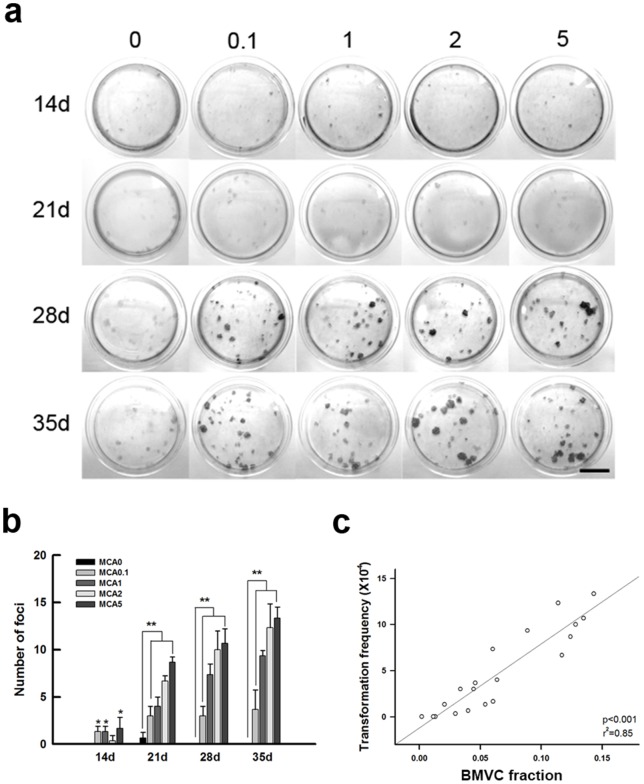
Figure 3. The correlation between the BMVC fraction and the frequency of foci formation in transformed cells.
(a) Foci formation of BALB/c 3T3 cells induced by different MCA doses (0.1, 1, 2, 5 μg/ml) and cultured periods (14, 21, 28, 35 days); scale bar = 2 cm. (b) Histogram representing the quantification of foci formation. (*p<0.05; **p<0.001 compared to the matched non-treated cells, paired t-test). (c) The correlation between the BMVC fraction and the frequency of foci formation expressed as the transformation frequency.

