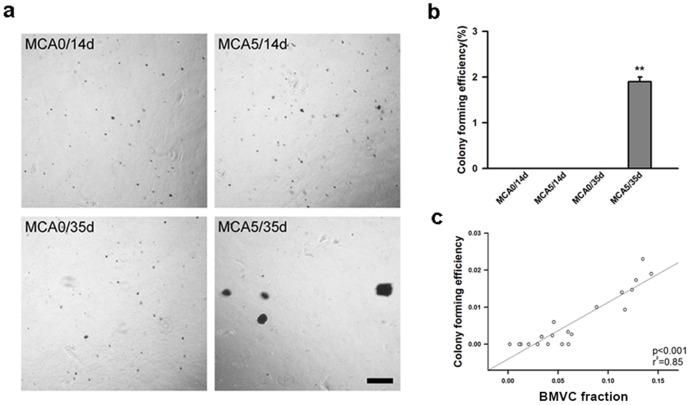
Figure 6. The correlation between the BMVC fraction and anchorage independent growth of the transformed cells.
(a) A soft agar assay was used to detect the anchorage independent growth of transformed cells from different experimental groups. Scale bar = 500 μm. (b) The quantitative analysis of the soft agar assay. The colony forming efficiency was calculated and compared (**P<0.001, t-test). (c) The correlation between the BMVC fraction and colony forming efficiency of transformed cells in the soft agar.

