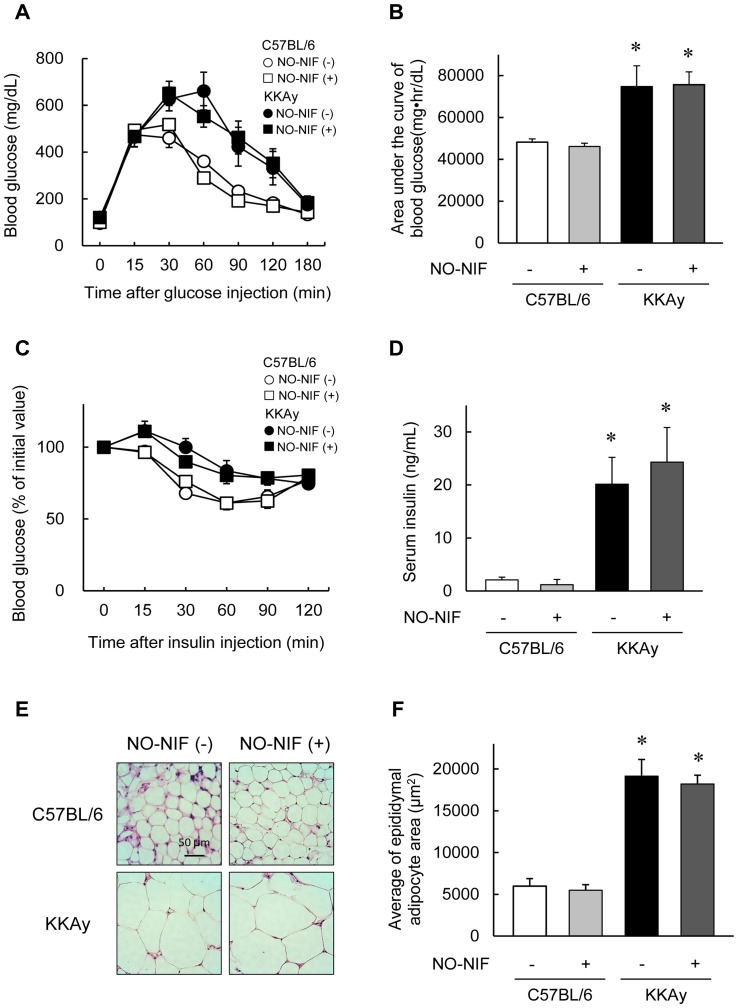
Figure 1. NO-NIF had no effect on glucose metabolism.
(A) Changes in the blood glucose level during IPGTT. (B) The area under the blood concentration versus time curve for glucose during IPGTT. Values are expressed as the means ± S.E., n = 8–10. *p<0.05 vs. vehicle-treated C57BL/6 mice. (C) Changes in the blood glucose level during ITT. Values are expressed as a percentage of the initial value. (D) Levels of serum insulin. Values are expressed as the means ± S.E., n = 8–10. *p<0.05 vs. vehicle-treated C57BL/6 mice. (E) Representative images showing hematoxylin-eosin staining of adipocytes in epididymal fat of the C57BL/6 and KKAy mice with or without NO-NIF. (F) Average of the epididymal adipocyte size. Values are expressed as the means ± S.E., n = 8–10. *p<0.05 vs. vehicle-treated C57BL/6 mice.

