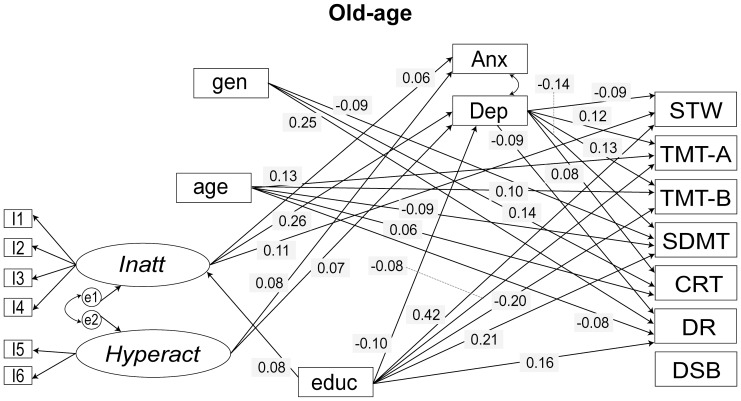
Figure 3. Final model for ADHD symptom–cognition analyses for OA cohort.
Only paths significant at p<0.01 are shown. Arrows reflect direction of relationships between variables. Standardised regression coefficients are shown. Factor loadings and covariance between the latent factors – Inatt and Hyperact, which were constrained equal across groups in the analyses, and correlation between cognitive test measures are not shown for the sake of simplicity. I: item; gen: gender; educ: education; Inatt: latent factor Inattention; Hyperact: latent factor Hyperactivity; DEP: depression symptom measure; ANX: anxiety symptom measure; STW: Spot-the-Word Test; TMT-A: Trail Making Test A; TMT-B: Trail Making Test B; SDMT: Symbol-Digit Modalities Test; CRT: Choice Reaction Time; DR: Delayed Recall; DSB: Digit Span Backwards.

