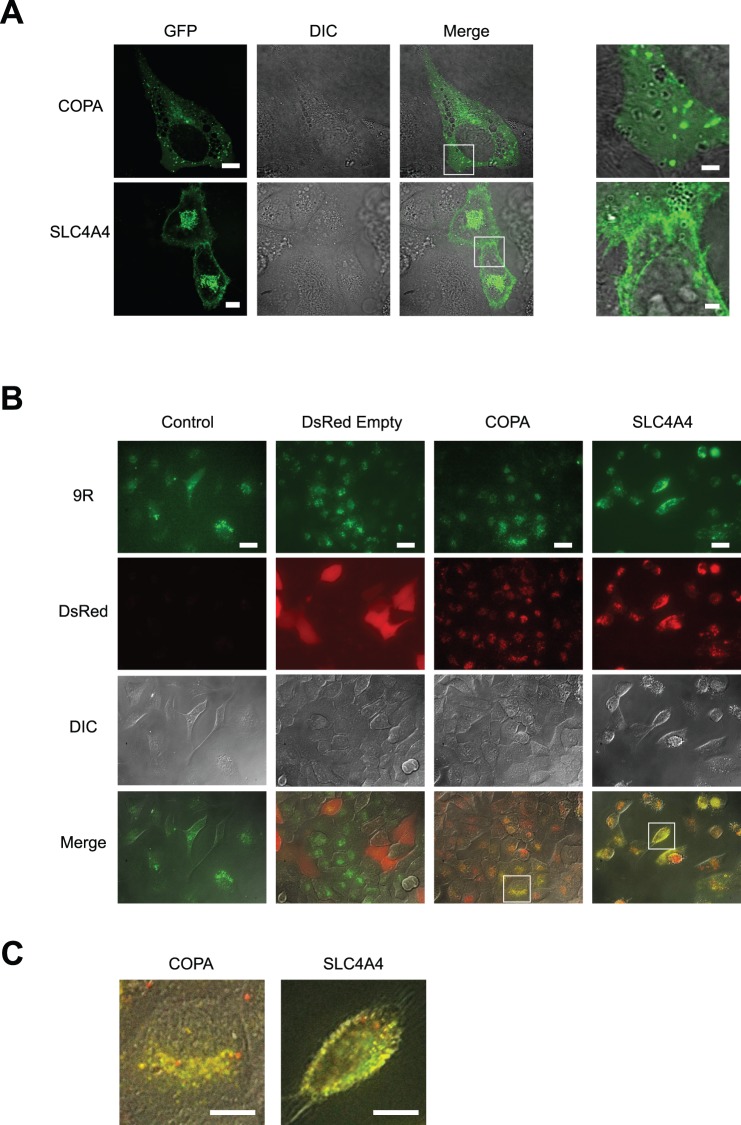
Figure 5. COPA and SLC4A4 co-localized with FITC-9R.
(A) Confocal images of EGFP-COPA and EGFP-SLC4A4 localization in HeLa cells. Scale bars, 10 µm. Right Panel, high magnification merge images. Scale bars = 2 µm. (B) Confocal microscopy images of double fluorescence imaging show the co-localization of FITC-9R with COPA or SLC4A4 in HeLa cells. HeLa cells identified by DIC (differential interference contrast), and signaling with FITC-9R (9R) (green) were also positive for COPA (red), and co-localization was evident when images were merged (yellow). Similarly, the expression of SLC4A4 co-localized with FITC-9R is shown. pDsRed empty vector was used as a negative control and did not show co-localization with FITC-9R. Scale bars, 20 µm. (C) High magnification images from Fig. 5A. Scale bars = 10 µm.

