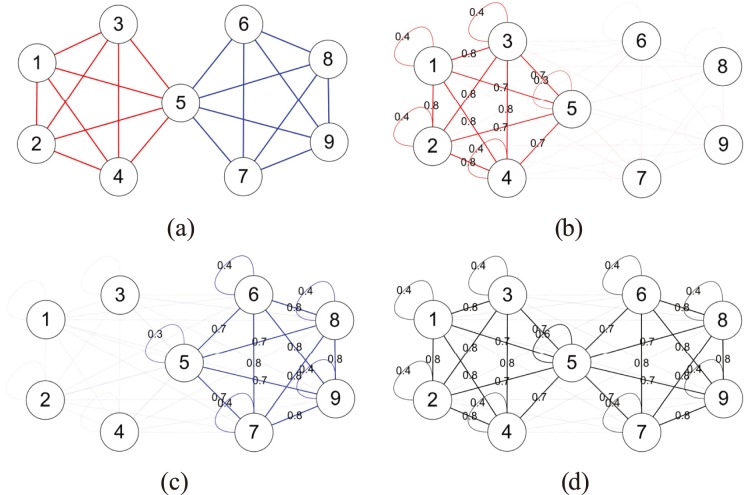
Figure 1. An illustration of our method for identifying the community structure of links.
(a) The given network G with two link communities (in red and blue). (b) and (c) The expected graph of the red and blue link community. (d) The expected graph of G, which is an ensemble of the expected graphs of its red and blue communities. Note that the width of a link corresponds to its expected values, and values smaller than 0.1 are omitted.

