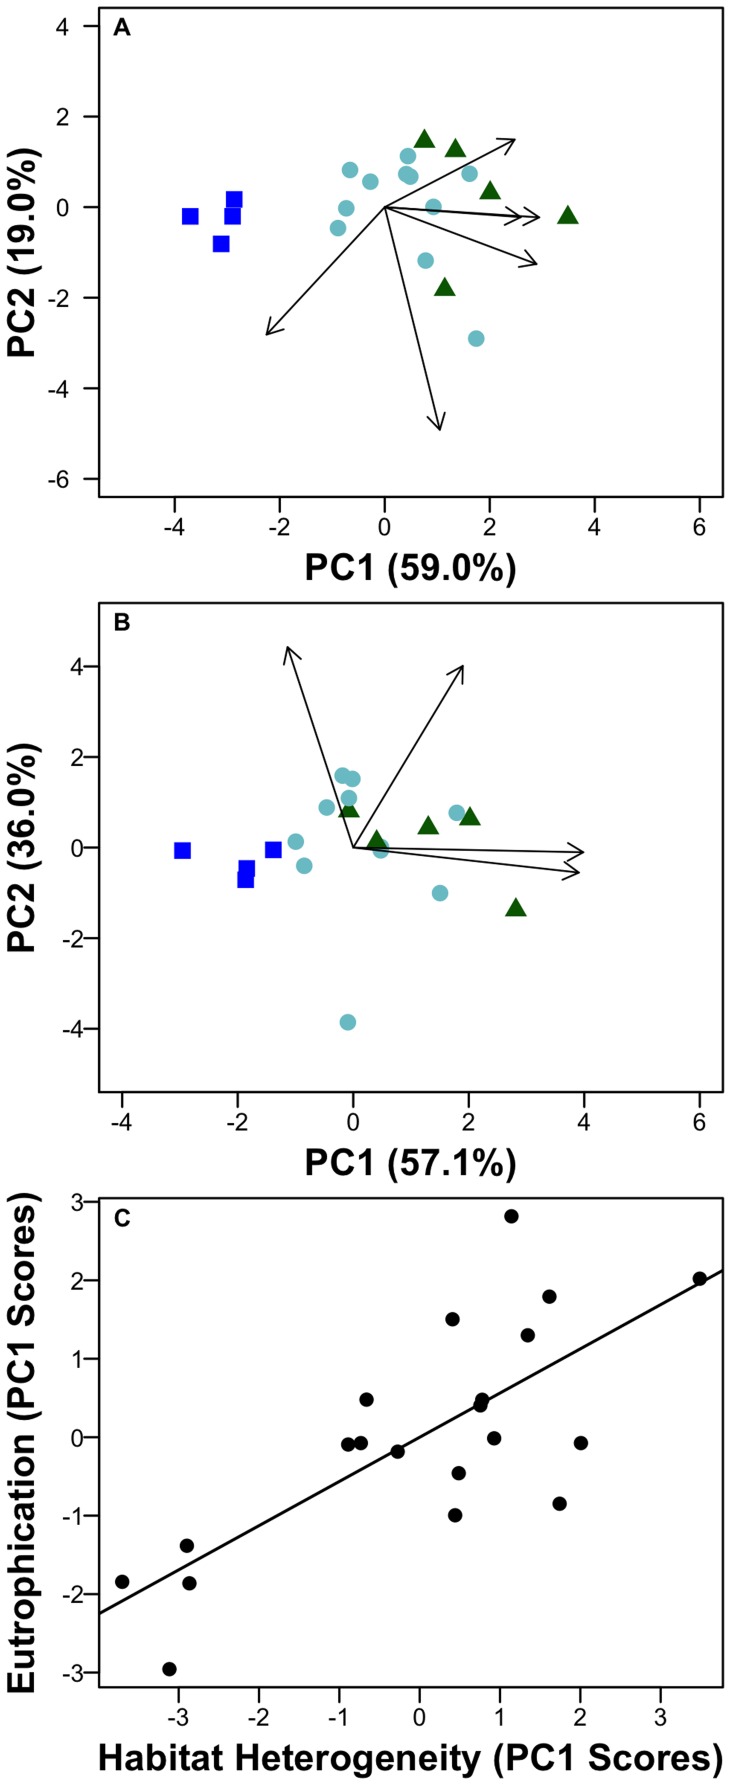
Figure 2. Principal component analyses (PCAs) showing environmental variation across lakes in this study.
Panel A shows PCA results based on trophic state variables, panel B shows PCA results based on Heterogeneity variables (standard deviation among depths in variables) and panel C shows the correlation between the trophic state PC 1 scores and heterogeneity PC 1 scores (R2 = 0.57). Arrows show significant variables (p<0.05) and values in parentheses show percentages of total environmental variation among lakes explained by each axis. ‘EpiTN’ = epilimnetic TN, ‘EpiTP’ = epilimnetic TP, ‘HypoTP’ = Hypolimnetic TP, ‘HypoDO’ = hypolimnetic DO, and DO = epilimnetic DO. ‘.std’ indicates that the standard deviation of measurements of the specified variable among layers. Triangles = eutrophic, stars = mesotrophic, and squares = oligotrophic lakes.

