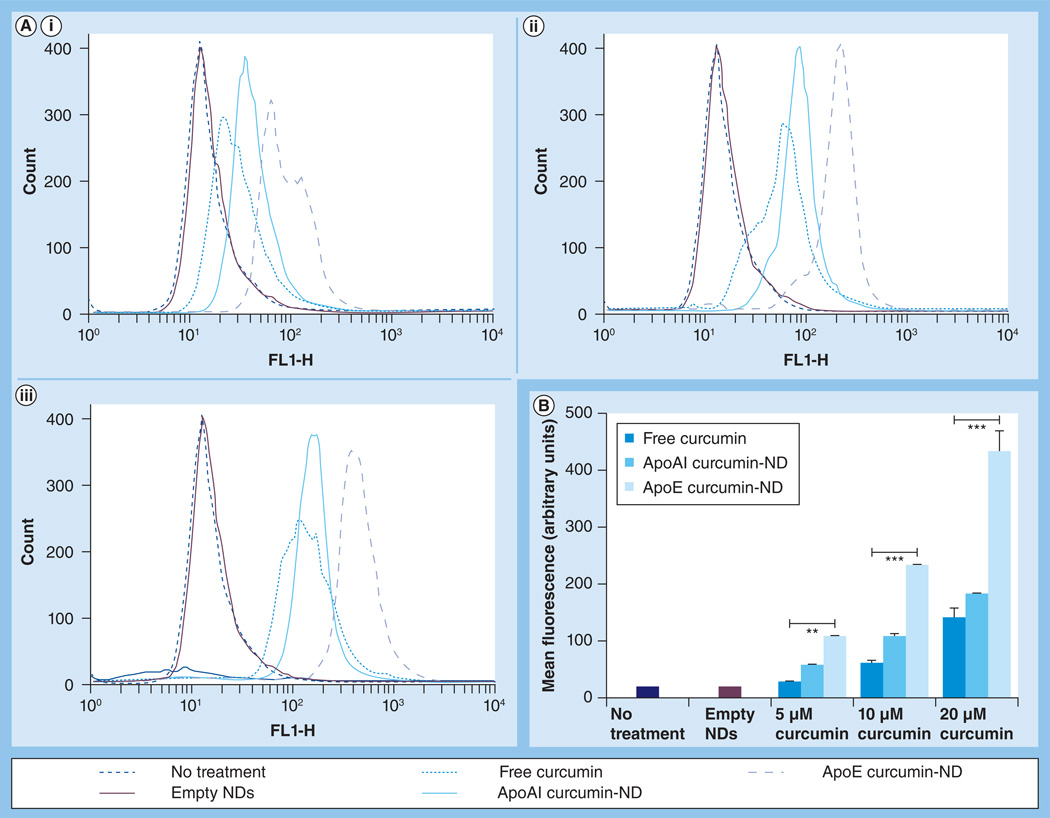
Figure 1. Effect of nanodisks on curcumin internalization by glioblastoma multiforme cells.
Following incubation for 24 h, cells were washed and analyzed by flow cytometry. (A) Representative data from three independent experiments, where ‘Count’ refers to the cell number. Each plot represents curcumin fluorescence detected for a cell population after incubation with (A,i) 5 µM, (Aii) 10 µM and (A,iii) 20 µM curcumin. (B) Mean curcumin fluorescence for >95% of the cell population as a function of curcumin concentration and formulation. The FL1 channel was used to detect curcumin fluorescence.
**p < 0.01.
***p < 0.001.
FL1-H: Height of the histogram that represents the mean curcumin fluorescence intensity detected by channel 1; ND: Nanodisk.

