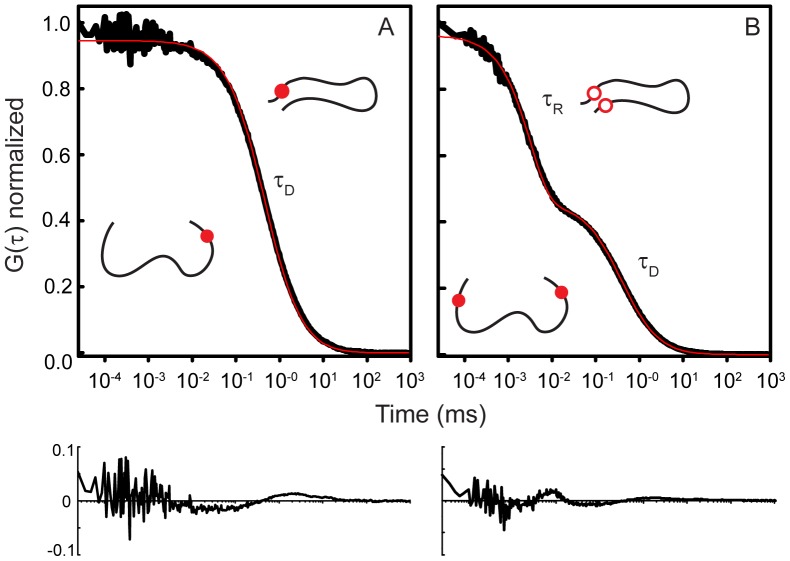
Figure 2. Representative autocorrelation curves of a single-labeled control construct (A) and of a double-labeled construct (B).
(A)The control autocorrelation curve shows the characteristic decay curve observed for the simple translational diffusion (τD) with no evidence for a second decay component. The TMR remains fluorescent (solid red circle), independent of the conformation of the protein. (B)The autocorrelation curve of the double-labeled construct has an additional fast decay component (τR), reflecting the intrachain diffusion that brings the fluorophores into close proximity, resulting in self-quenching (open red circles), which is relieved when the fluorophores diffuse apart (solid red circles). Red traces correspond to fits with Eq. 1 where A = 0 (no kinetic component; A) and with Eq. 1 (B), with accompanying residual plots.

