
Figure 4. Fundamental-frequency difference limens.
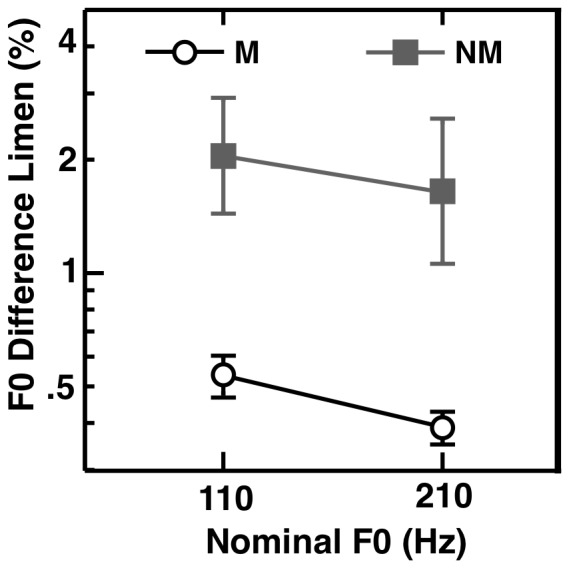
Musicians (open circles) demonstrate significantly better F0 discrimination limens than non-musicians (grey filled squares) for lowpass-filtered harmonic complexes with F0s centered around 110 Hz and 210 Hz. Error bars represent +/−1 s.e. of the mean.