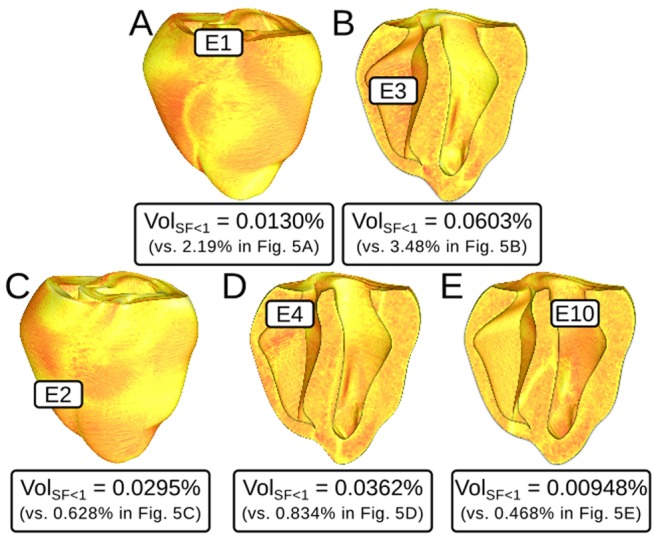
Figure 6. Maps of SF for propagation during the first excitation cycle following ectopic stimulation from several different sites in simulations with 40% of normal INa (same scale as Fig. 5); location and timing of all 5 PVCs is identical to Fig. 5.

None of the PVCs analyzed here induced reentry. Labels show quantitative comparison to the corresponding SF maps in Fig. 5. VolSF<1: percent volume of tissue in the ventricles with SF<1. Comparison of VolSF<1 to the corresponding values in the simulations with 30% of normal INa shown in parentheses.
