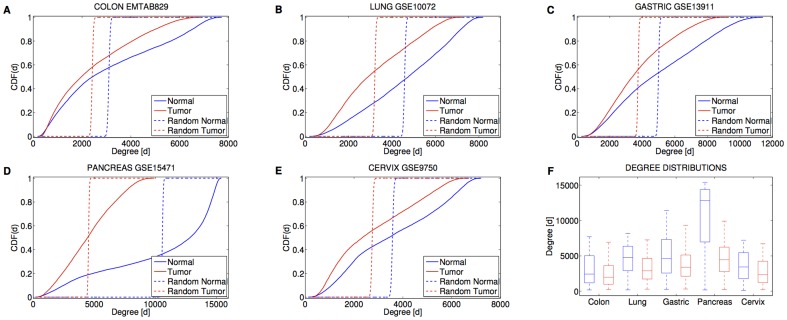
Figure 2. Cancer tissues are characterized by loss of connectivity.
(A-E) Cumulative distribution functions of the gene degree. (F) Boxplots of the gene degrees for the five tissues in the two conditions. Red color refers to the cancer phenotype. Blue color refers to the normal phenotype. The median degree in cancer is lower than in normal conditions.

