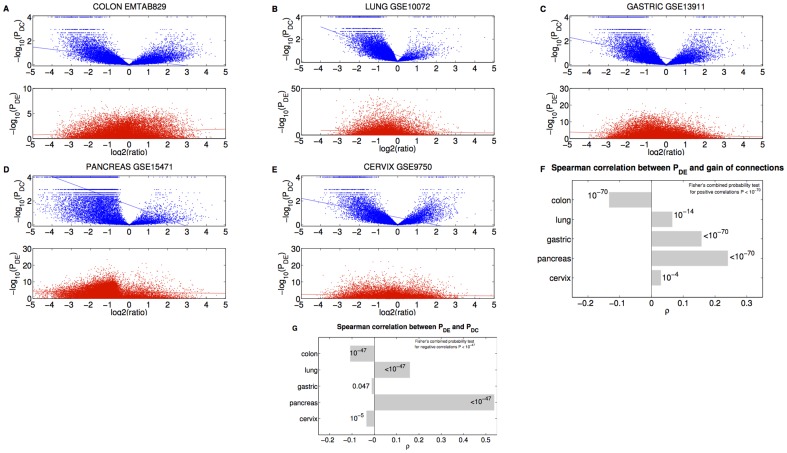
Figure 4. Comparison between differential expression and differential connectivity.
(A-E) (Upper panel) Gene differential connectivity p-value  as a function of degree ratio
  . (Lower panel) Gene differential expression p-value
  as a function of degree ratio
  . Each point represents a gene and the trend line is the least-square line. (F) Correlations between the differential expression p-value and the gain of connections. P-values on the bars refer to right-tail tests for the positive correlations, and left-tail tests for the negative correlations. (G) Correlations between differential expression p-values and differential connection p-values.

