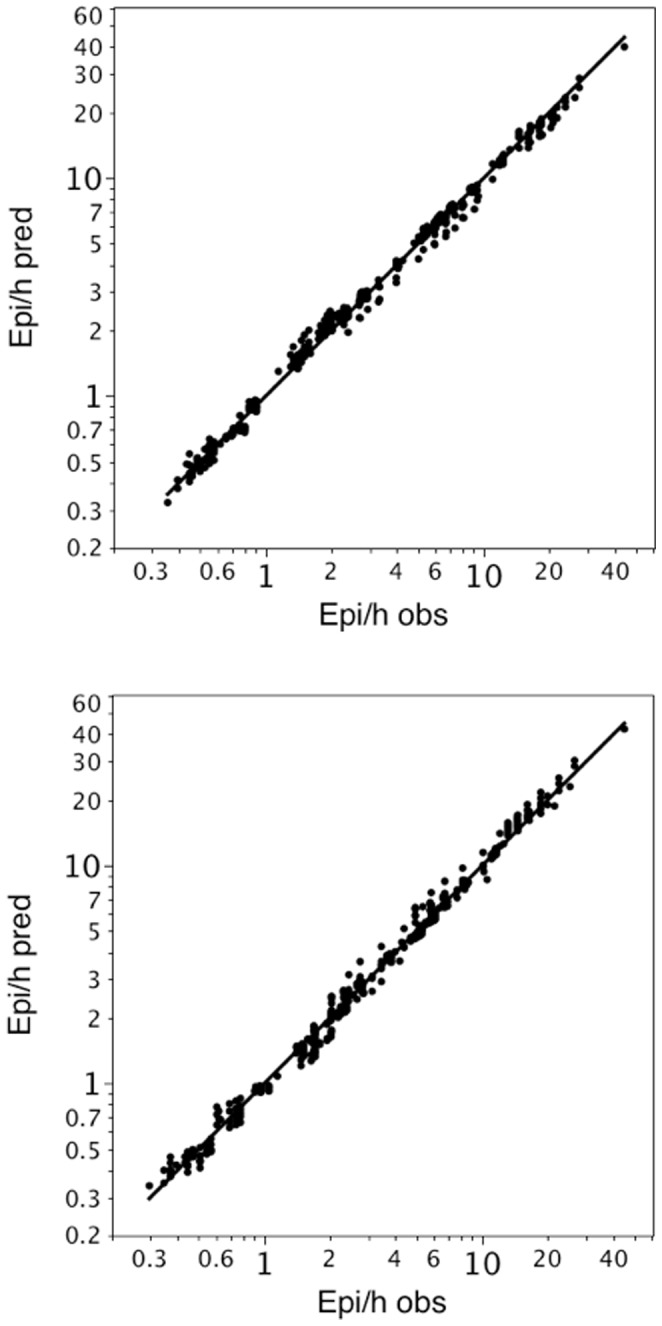
Figure 1.

a. Bivariate fit of observed and predicted desaturations per hour with Group 1 as training set. Group 1 has been used as training set to generate the different exponents c for the formula. For group 2 (test set) predicted desaturations have been calculated (based on the exponents of group 1). The predicted desaturations (Npred/h) for Group 2 are plotted against the observed desaturations (Nobs/h) of Group 2. The concordance correlation coefficient was 0.997 b. Bivariate fit of observed and predicted desaturations per hour with Group 2 as training set. Group 2 has been used as training and Group 1 as test set. The predicted desaturations (Npred/h) for Group 1 are plotted against the observed desaturations (Nobs/h) of Group 1. The concordance correlation coefficient was 0.998
