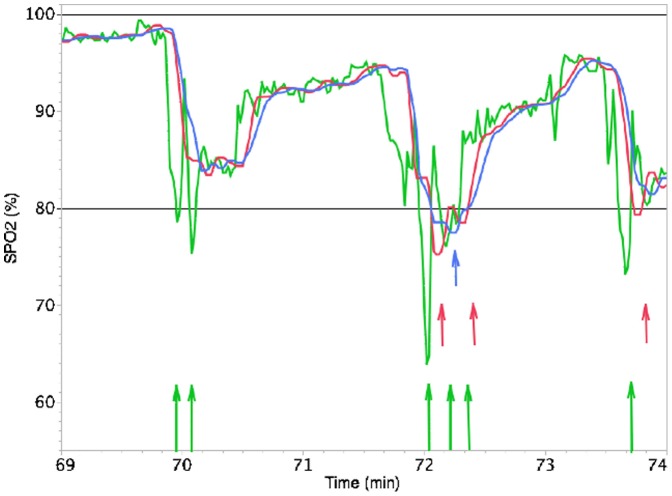
Figure 2. Influence of the averaging time and the desaturation duration on the number of desaturations.
SpO2 recordings for averaging times of 3 seconds (green), 10 seconds (red) and 16 seconds (blue). For an alarm threshold at 80% SpO2 (straight line) and an arbitrary desaturation duration, an averaging time of 3 s results in 6 desaturations, while an averaging time of 10 or 16 s results in 3 and 1 desaturation(s), respectively. For a desaturation duration ≥15 s, an averaging time of 3 s or 10 s results in no desaturation, while an averaging time of 16 s results in 1 desaturation.

