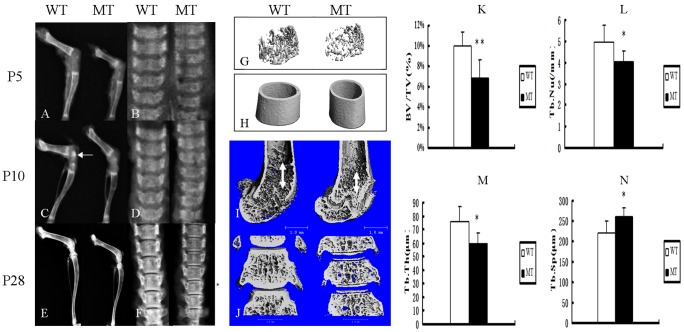
Figure 2. Fgfr2+/S252W mice had shortened bone length and decreased bone mass compared with wild-type mice.
(A–F) X-ray analyses of femora, tibia and lumbar vertebrae from WT and MT mice at P5 (A, B), P10 (C, D) and P28 (E, F) revealed shorter bone length and lower bone density in mutant mice. At P10, the appearance of the secondary ossification centers (white arrow) was delayed in mutant tibia epiphyses. (G, H) Three-dimensional images showed reduced trabecular bone in mutant mice, thought the thickness of the diaphyses was not reduced at P14. (I, J) Micro-CT three-dimensional images of femora and lumbar vertebrae at P28 showed short and sparse trabecular. The double arrows indicate the length of trabecular. (K–N) Quantification of the structural parameters of the femoral metaphysis (P14) revealed that BV/TV, Tb.N, and Tb.Th decreased significantly, though Tb.Sp was higher in MT mice relative to WT mice. Graphs show the mean value ± SD (Student's t-test, *P<0.05, **P<0.01).

