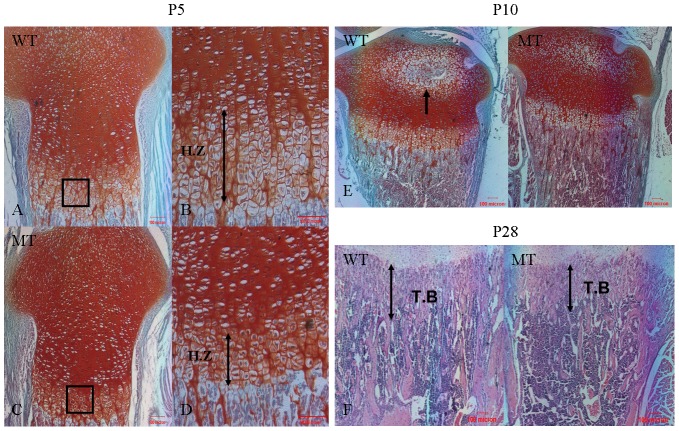
Figure 3. Histochemical analysis of tibia from wild-type mice and Fgfr2+/S252W mice.
(A, C) Safranin-O/Fast green (SO/FG)-stained sections of the proximal tibia of P5 mice showing the epiphyseal growth plate. The height of the growth plate was shorter in mutant mice. (B, D) Enlarged view of the boxed regions in A and C showing the morphology of the hypertrophic zone. The length of the hypertrophic zone was shorter, indicated by double arrows. Notably, the volume of hypertrophic chondrocytes was smaller, with disorganized arrangement. (E) SO/FG staining shows the appearance of the secondary ossification center (arrow) in the tibia of WT mice but not in MT mice at P10. (F) H&E staining shows that the length of the trabecular bone (double arrows) in the tibia was shorter in MT mice. (A, C) 100×; (B, D) 200×; (E, F) 40×. H.Z, hypertrophic zone; T.B, trabecular bone. Scale bars = 100 µm.

