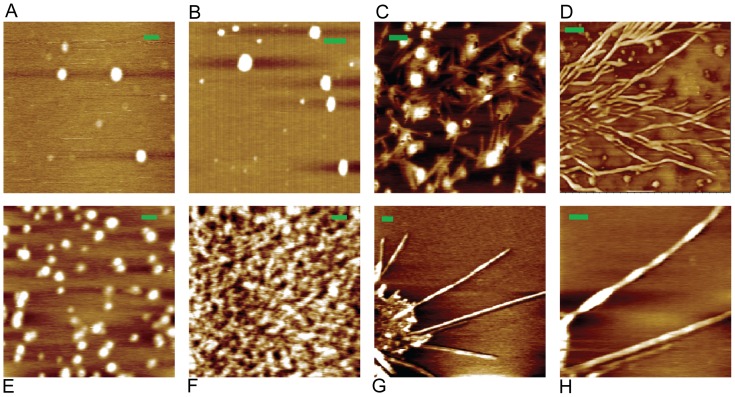
Figure 3. Morphology of HEWL aggregates.
Observed morphology of HEWL aggregates after incubation in pH 12.2 (unless indicated otherwise) for 12 hours observed using non-contact mode atomic force microscopy with indicated monomer concentrations is shown. A: 3 µM; B: 120 µM; C: 0.3 µM; D: 120 µM; E: 0.3 µM; F: 3 µM in pH 7; G: 0.3 µM; H: fibril in ‘G’ rescanned at higher magnification; Scale bar = 100 nm. Heights in Z-axis for all images were within 0—2 nm. See images of amyloid fibrils after 3 weeks in Figure S4.

