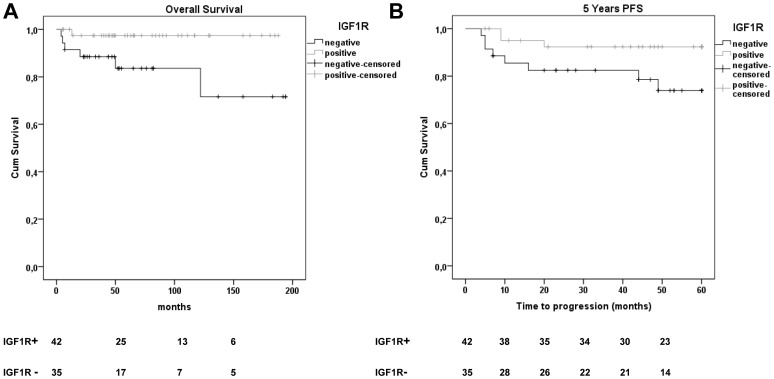
Figure 2. Kaplan-Meier curves for progression free survival (PFS) and overall survival (OS) in IGF-1R expression defined subgroups of cHL patients.
The overall survival was lower in the IGF-1R negative group (83%) as compared to the IGF-1R positive group (98%; P = 0.029). The 5-year PFS was lower in the IGF-1R negative group (77%) as compared to the IGF-1R positive group (93%; P = 0.047). Numbers below the graph are the number of patients for each group included at that time point.

