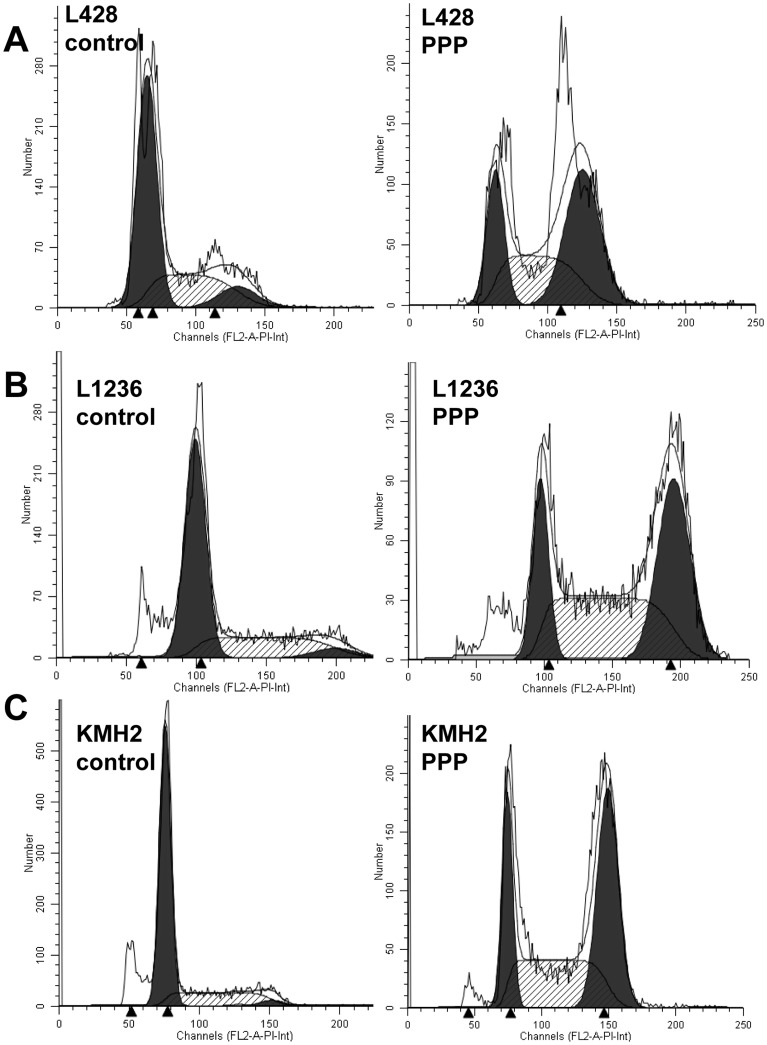
Figure 5. The effect of PPP on cell cycle progression of cHL cell lines.
A, L428 cell cycle analysis. B, L1236 cell cycle analysis. C, KM-H2 cell cycle analysis. Flow cytometry histograms are given with a fitted analysis model, in which dark gray areas are calculated areas for cells in G0/G1 and G2 phase and the shaded area is the calculated area for cells in S phase. Cell cycle distribution upon treatment with PPP (2 µM)-treated for 24 hours revealed a clear G2/M cell cycle arrest in all cell lines. Representative figures are given. Results of triplicate experiments are given in supplementary figure 2.

