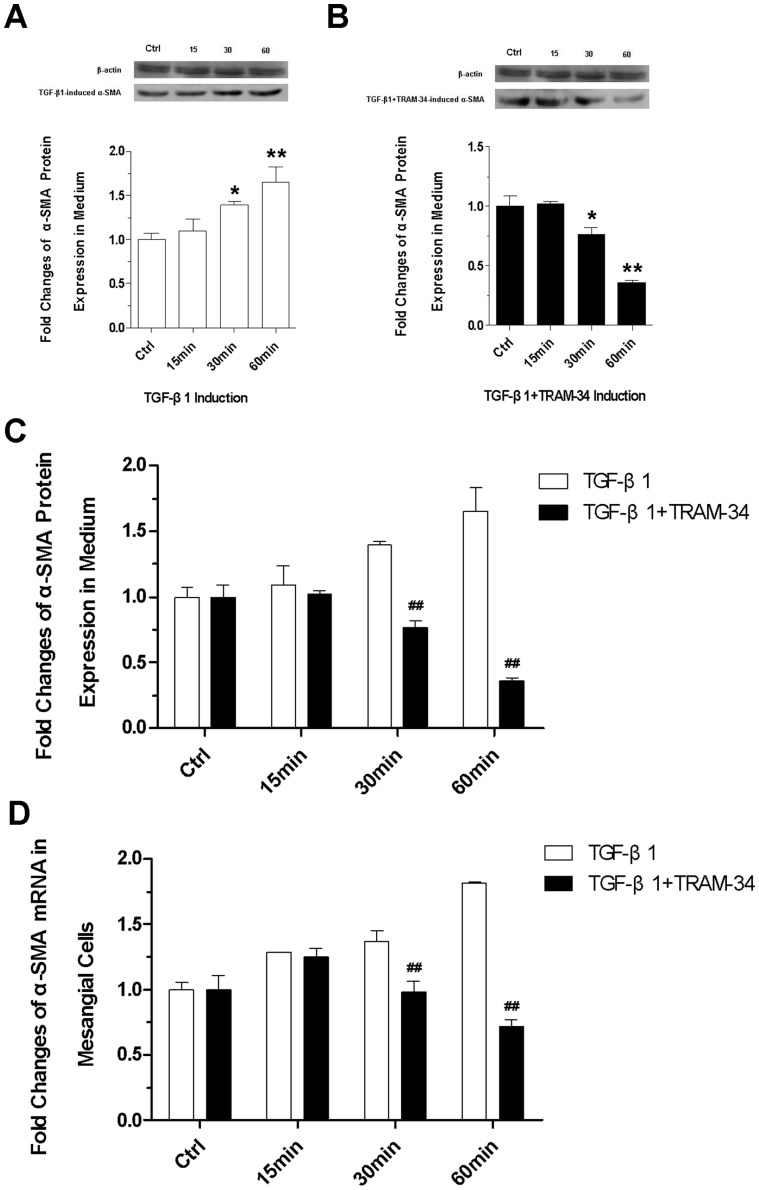
Figure 4. Expression of α-SMA.
(A) Immunoblotting analysis of TGF-β1-induced α-SMA and (B) TGF-β1+TRAM-34-induced α-SMA protein expression with different induction time (15 min, 30 min, 60 min); (C) Differences between the TGF-β1- and the TGF-β1+TRAM-34-induced α-SMA protein expression at 30 min and 60 min; (D) RT-PCR assessments for α-SMA gene expression (* P<0.05 and ** P<0.01versus control; # P<0.05 and ## P<0.01 versus the TGF-β1-induced; n = 4).

