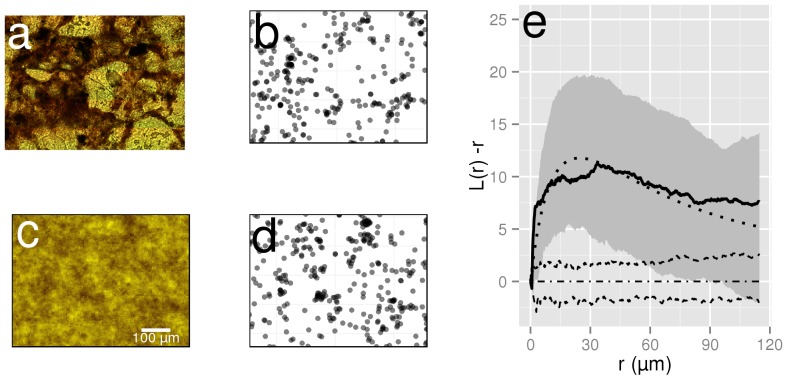
Figure 1. Bacterial habitat, observed and simulated distribution of bacteria in a soil thin section.
(a) Bright field image of a soil thin section showing various soil features that characterise the soil microbial habitat and (b) bacterial distribution observed in the same thin section. (c) Random probability field generated using parameters estimated from b (μ = −7.64; σ2 = 2.0 and β = 12.95) and (d) simulated bacterial distribution using c. as random intensity (LGCP model). Colours for the random field were chosen to match those of the thin section image. Darker shades indicate higher probability of bacterial presence. The scale for all panels is identical and is indicated in c. (e) Transformed Ripley functions L(r) - r for the observed bacterial distribution shown in a. (solid line) and envelopes of 99 simulations under CSR and LGCP. The dashed lines indicate the envelope of CSR simulations of the same intensity as a. and the shaded area the envelope of simulations of an LGCP with parameters estimated from the observed point distribution. The dotted line corresponds to the theoretical functions under LGCP and the dashed-dotted line to the theoretical function under CSR. In e., L(r)-r above 0 indicates that the point pattern is more aggregated than a random process.

