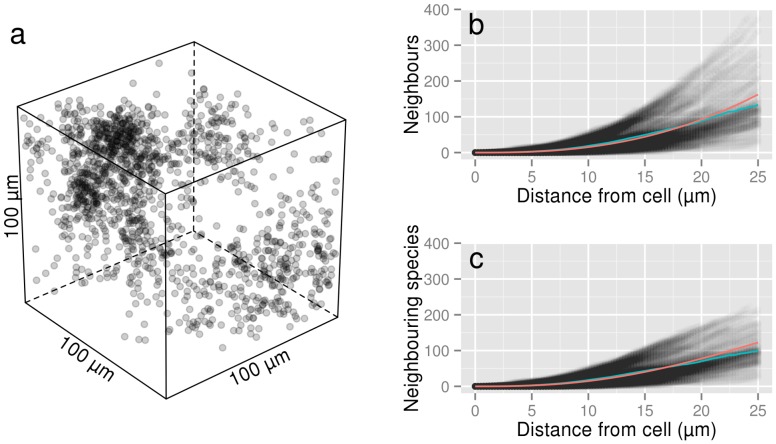
Figure 2. 3D simulation of bacterial distribution.
(a) 3D representation of bacterial distribution in a 100×100×100 µm3 cube as simulated by LGCP. The model parameters for the simulation were μ = −7.52, σ2 = 1.90 and β = 25. (b) Number of neighbours as a function of distance for each bacterium (scatterplot), average number of neighbours (red line) and theoretical number of neighbours for the LGCP (blue line) and (c) Number of neighbouring species assuming a random distribution of species among individuals (line colours are the same as in b). The number of species considered in this simulation was S = 450, corresponding to Fisher's α = 221.86 (estimated from [1]).

