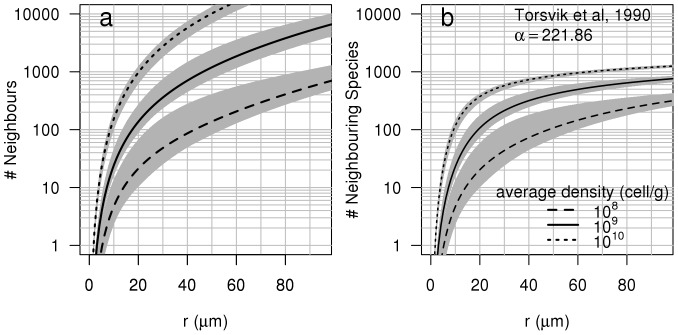
Figure 3. Number of neighbours and neighbouring species.
(a) Mean number of neighbours and (b) neighbouring species around an “average” bacterium as a function of distance from the bacterium and as a function of bacterial density. The mean number of neighbours and neighbouring species are derived from Ripley's K(r) function of LGCP with parameters μ = −10.26, σ2 = 2.90, β = 20 for the 108 cells g−1 soil density, μ = −7.52, σ2 = 1.90, β = 25 for the 109 cells g−1 soil density and μ = −4.91, σ2 = 1.29, β = 25 for the 1010 cells g−1 soil density. Grey envelopes surrounding curves represent the maximum and minimum of these numbers calculated from 39 simulations. Note the logarithmic scale on the y axis.

