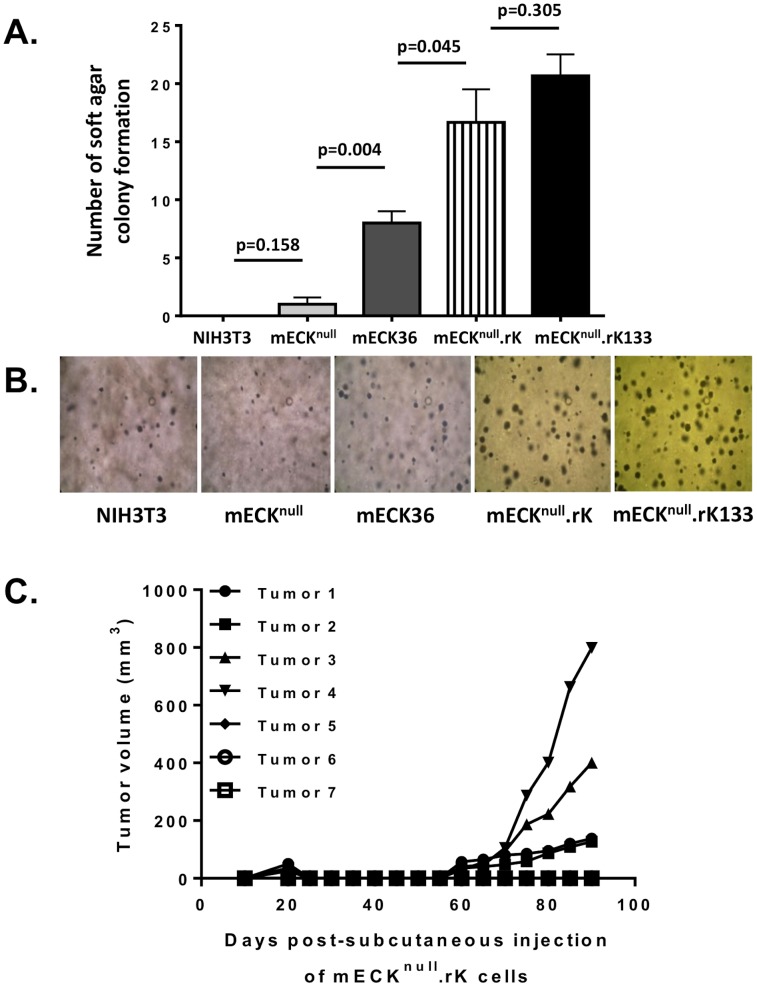
Figure 2. mECKnull.rK exhibit variable tumorigenicity.
(A) A graph depicting number of colonies formed in soft agar at 4 weeks from 5000 single cells originally plated. Error bar represents standard deviation of number of colonies counted in 10 separate fields imaged at 10×. NIH 3T3 cells and mECKnull cells do not form appreciable colonies while mECKnull.rK and mECKnull. rK133 cells exhibit robust colony formation. Error bars represent the SD between triplicate wells. (B) Representative image at 10× magnification of colonies in soft agar taken 4 weeks after plating single cell suspensions of NIH3T3, mECKnull, mECK36, mECKnull.rK and mECKnull. rK133. (C) Graph depicting mECKnull.rK tumor kinetics in athymic nu/nu mice. 3×10⁶ mECKnull.rK cells were subcutaneously injected into the hind flanks of 7 athymic nu/nu mice. 8 weeks later solid tumors were palpable in 4 of the 7 mice. Growth was monitored by caliper measurement.

