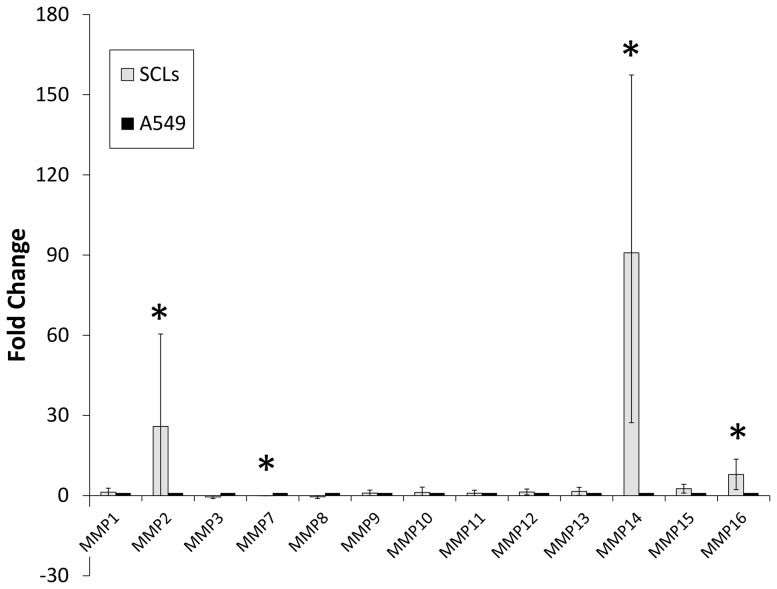
Figure 1. The results of the PCR array analysis focused on the matrix metalloproteinases (MMPs) of SCLs.
The expression levels of MMP-14 and MMP-2 of SCLs were higher than those of A549 cells, while the level of MMP-7 was lower. These data were analyzed by a web-based software program (the RT2 Profiler PCR Array Data Analysis, version 3.5). Error bars showed 95% Confidencial intervals. (* p-value <0.05 versus A549, n = 5)

