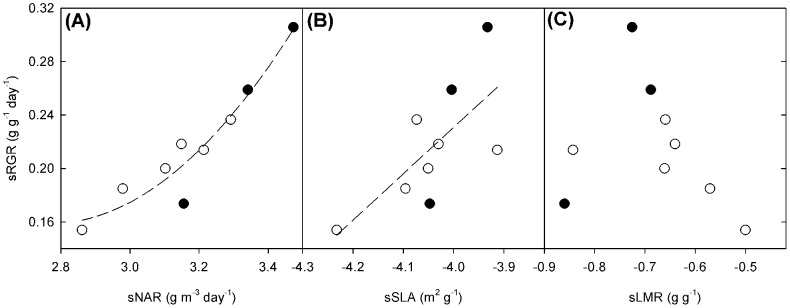
Figure 4. Relationship between sNAR, sSLA and sLMR and sRGR.

Regression slopes for the relationships between (a) sNAR and sRGR (F2,6 = 31.98, P<.001, R2 = 0.914); (b) sSLA and sRGR (F1,7 = 6.781, P<.05, R2 = 0.492); and (c) sLMR and sRGR for the three crop progenitors (closed symbols) and six wild species (open symbols).
